Reporting via Data Warehouse Integration
Please note:Ironclad now uses the OAuth 2.0 Authorization Framework to authenticate API requests. As of November 22nd, 2024, our previous bearer token method of authentication has been deprecated. We are currently in the process of updating this guide with details on how to implement with OAuth 2.0. In the meantime, please refer to our article Migrating to OAuth 2.0.
Overview
Ironclad's Contract Repository enables companies to store, search, and report on executed contracts and structured contract properties. The data stored in these contracts, however, may be valuable across many different applications. In this guide, we’ll show you how to integrate contract data into a data warehouse to enable reporting and analytics outside of Ironclad.
We will be using specific data warehouse and reporting tools in this guide. The concepts here should be applicable to other technologies with appropriate modifications.
Note: This guide and any software contained in it should be used at your own risk by individuals qualified to evaluate its effectiveness. IT IS PROVIDED “AS IS”, WITHOUT WARRANTY OF ANY KIND, EXPRESS OR IMPLIED, INCLUDING BUT NOT LIMITED TO THE WARRANTIES OF MERCHANTABILITY, FITNESS FOR A PARTICULAR PURPOSE AND NONINFRINGEMENT. IN NO EVENT SHALL IRONCLAD BE LIABLE FOR ANY CLAIM, DAMAGES OR OTHER LIABILITY, WHETHER IN AN ACTION OF CONTRACT, TORT OR OTHERWISE, ARISING FROM, OUT OF OR IN CONNECTION WITH YOUR USE OF THIS GUIDE OR ANY SOFTWARE IT CONTAINS.
Your use of the Ironclad API must comply with Ironclad’s API Terms of Use (available at https://legal.ironcladapp.com/api-terms-of-use) and the terms of the Enterprise Services Agreement (or equivalent) entered into between you and Ironclad.
Requirements
-
Ironclad environment: You will need an Ironclad production or demo environment with the API enabled, and some repository data.
-
API Tokens: In order to use the Ironclad public API, you will need to generate an API token for your Ironclad environment. Tokens can be generated by logging into Ironclad and navigating to our Name] → → Company Settings → API.
Solution Example
This example will pull data from the Ironclad API on a set interval. For more real-time data, you may want to consider an event-driven workflow by utilizing Ironclad webhooks.
This solution guide uses the following technologies:
- A Node.js script running in a server environment (e.g., Google Cloud Run/App Engine/etc.) to facilitate retrieving and pushing of data
- Google BigQuery as the data warehouse storage solution
- Google Data Studio for visualization
The figure below shows the interaction of these components with your Ironclad environment.
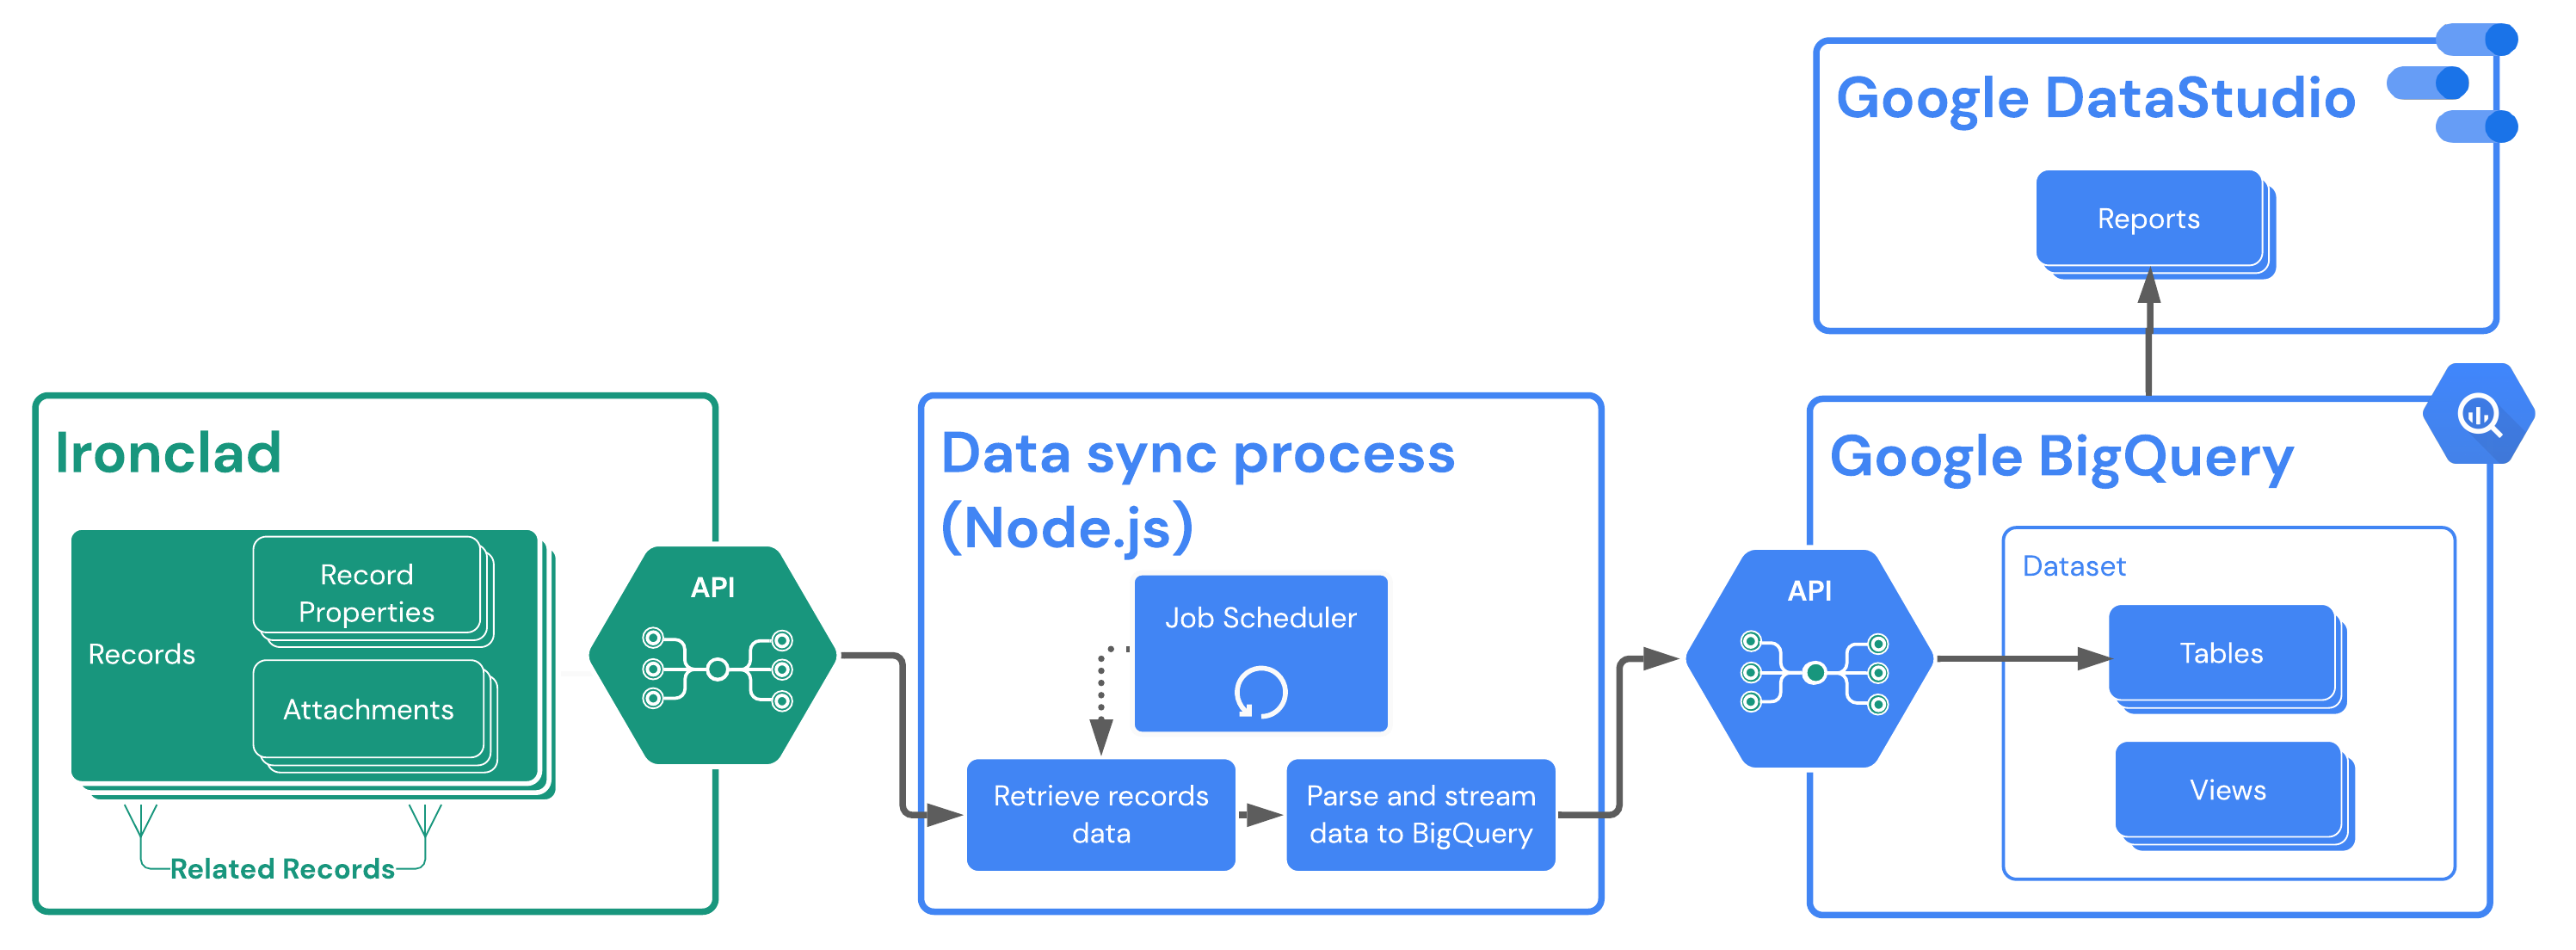
Ironclad Set Up
In this example solution, we are loading a set of standard record properties from the Ironclad repository, specifically:
- ID: The unique ID for the record in the repository
- Type: The type of the workflow that generated the record
- Name: The name of the contract record
- Last Updated: The date of the last update to this record in the repository
In addition, we are assuming that the records have a custom property named "Agreement Date", as a date field. This property would need to be defined in the workflow that created the record.
BigQuery Set Up
We assume here that you already have a Google Cloud project setup to use BigQuery. For specific BigQuery set-up questions, please refer to their documentation. This guide is only meant to cover high-level concepts and does not include all steps needed for a production-level configuration.
Your BigQuery setup will consist of setting up a dataset, table, and view. The purpose for each of these is:
- A dataset allows us to have a central location where we want a specific subset of data to reside in BigQuery while isolating it from other resources.
- A table is a container that holds structured data for a specific type of data. For our example, we will want a “records” table that stores only information about an Ironclad record. No other types of data will exist in this table.
- A view allows us to interface with the data of a table by applying specific formatting/structure for output. This is especially helpful when you may want to only expose certain fields or pieces of data for consumption in another platform (e.g., Tableau, Google Data Studio, etc.)
Now let's go through the BigQuery setup steps for our example:
1. Create Dataset
Ensure you have a dataset created in BigQuery to house your table(s). You can do this from the Cloud Console, or using the BigQuery command-line tools.
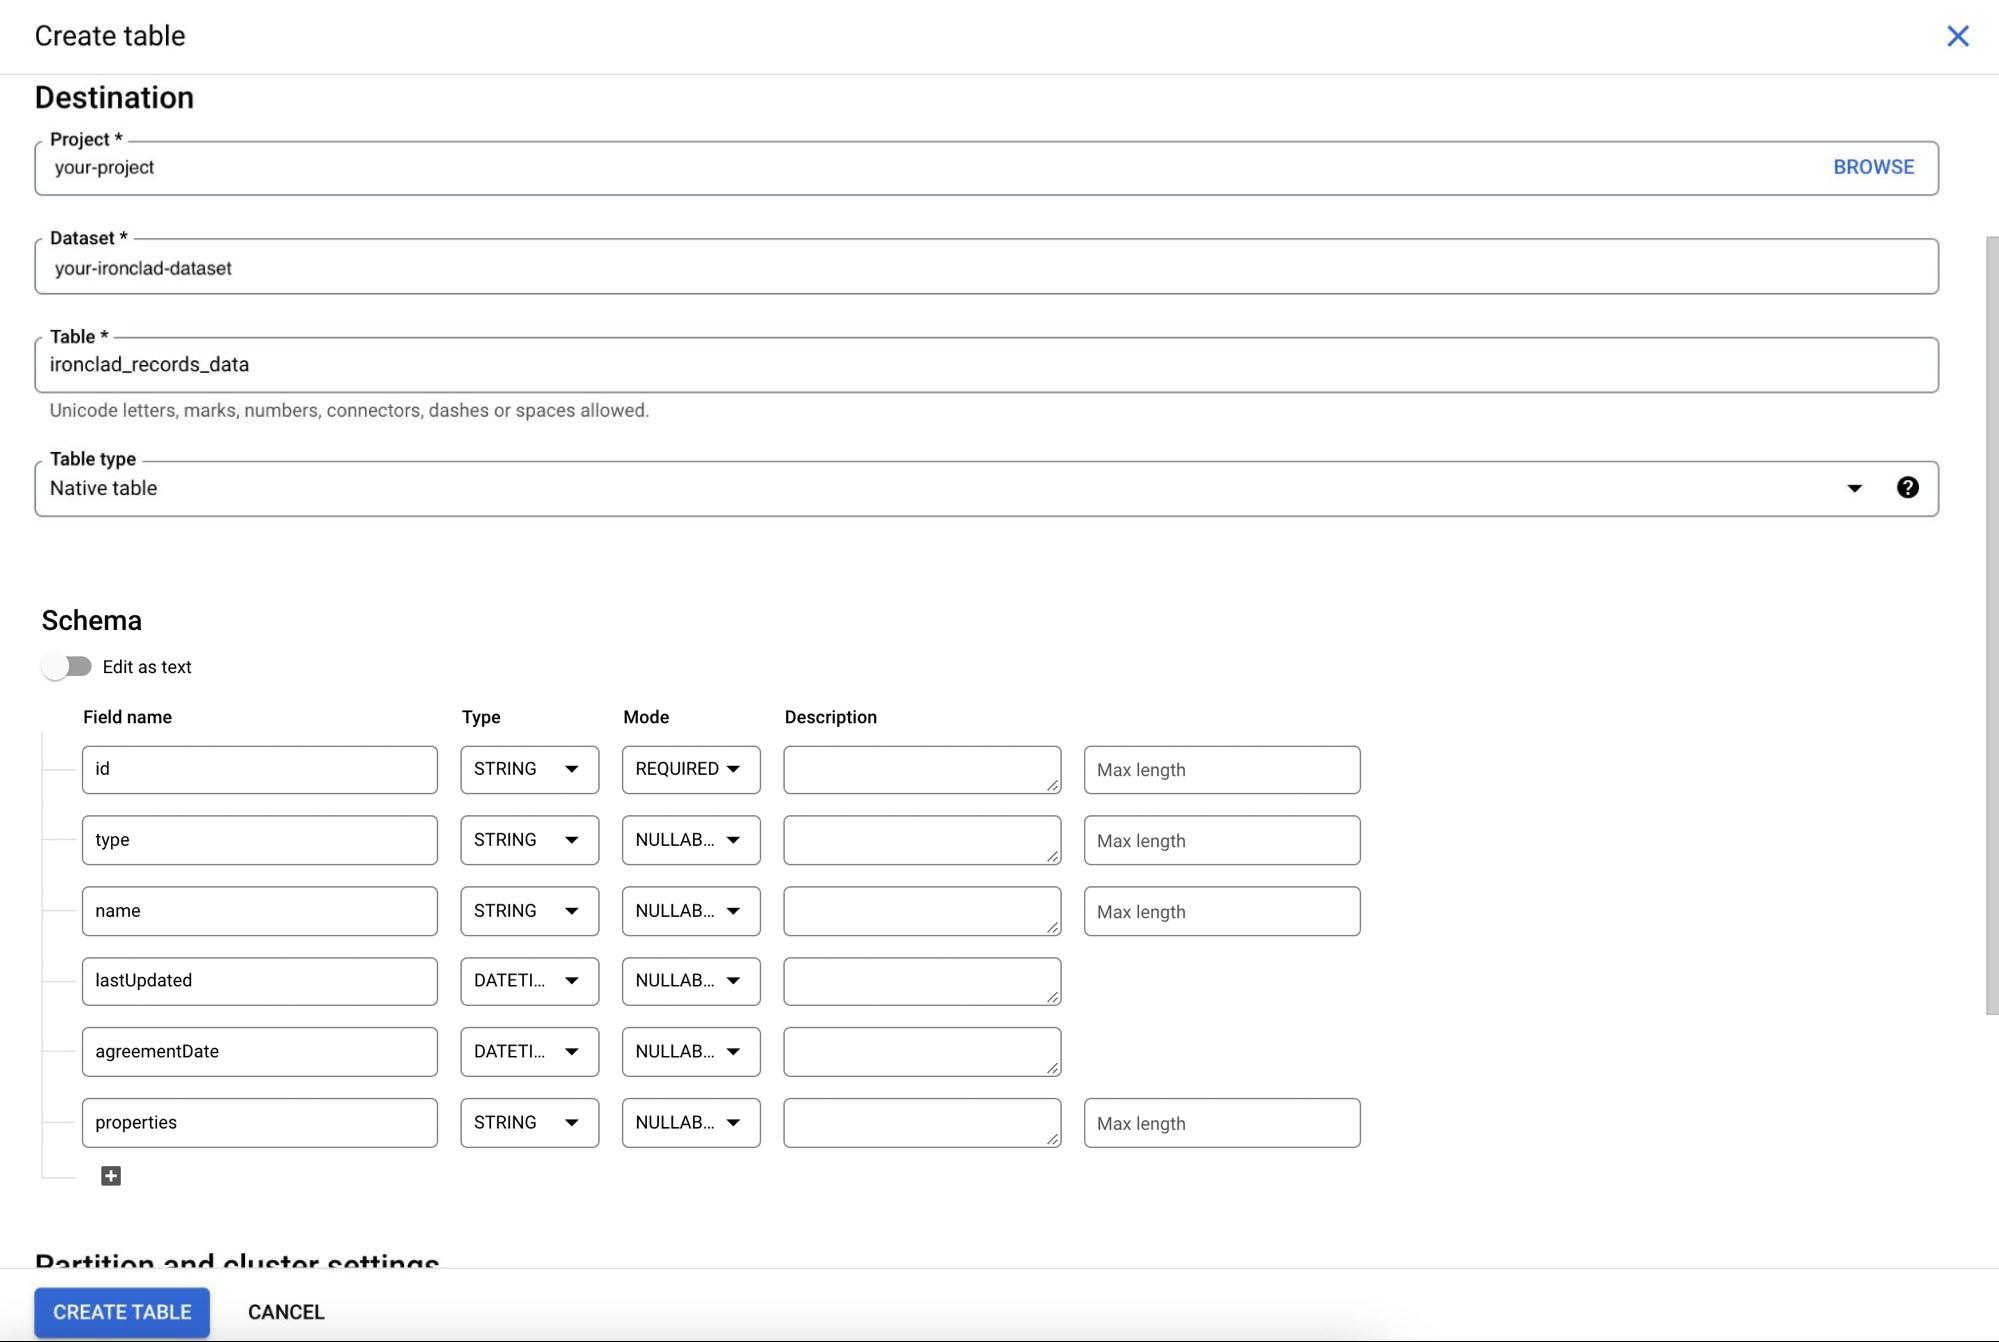
2. Create Records Data Table
Create a BigQuery table in the dataset you just created with the fields that you’d like inserted into the table when retrieving Ironclad records data. For our example, we've defined a field for each property we want to store from the Ironclad records. We also created a properties field where we will store a stringified version of the entire properties JSON object returned for a record from the Ironclad API. We are doing this to demonstrate some options in terms of mapping and storing record data in a warehouse. Mapping record properties one-to-one to fields in the data storage makes the data easier to access via queries and creating field relationships with other data entities, but it forces you to mirror the record structure in your data storage, and limits the data you can access there to only the fields that have been mapped. Storing the "raw" JSON data in a field allows you to capture all of the record data no matter what fields have been defined in your Ironclad workflows, but it forces you to add logic on the data storage side to transform the raw data into fields that can be incorporated into reports, etc (as we'll demonstrate in the next section). The "correct" approach for your case will depend on how specific your reporting and analysis needs are, and how much variability you expect in your Ironclad workflow definitions over time.
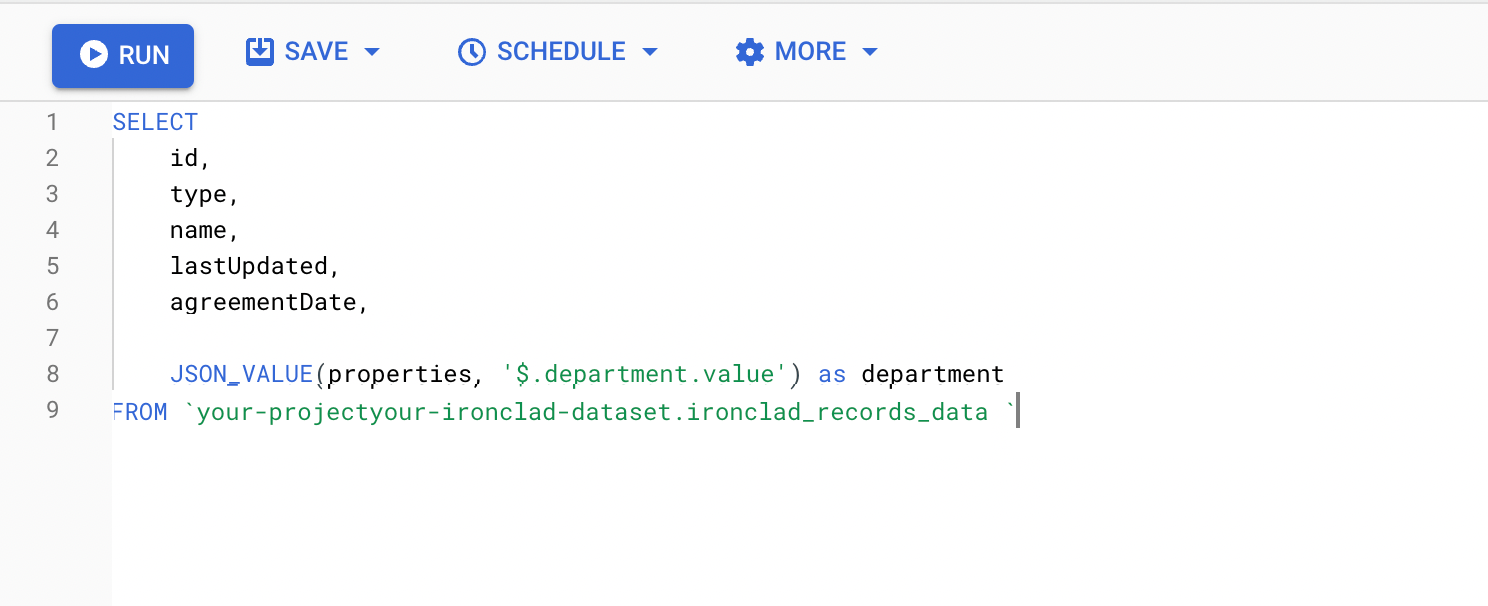
3. Create View of Records Data
With our record properties stored as a stringified JSON object in BigQuery, creating a view will be a good way of extracting specific data points that you'd like for visualization/analysis.
The figure below shows an example query that will be used to create a BigQuery view, allowing us to extract a specific department value from our contracts.
Node.js Process Set-Up
Project Dependencies
Our Node.js example code uses the following NPM packages:
- @google-cloud/bigquery: used to interact with BigQuery APIs
- axios: helpful HTTP library when interacting with the Ironclad API
- dotenv: simplifies bringing environment variables into the Node.js execution. Note: there are better and more secure solutions (e.g., Google Secret Manager) that you should consider in a production environment
- express: used to provide a way for a job scheduler service to invoke the data load process through an HTTP call
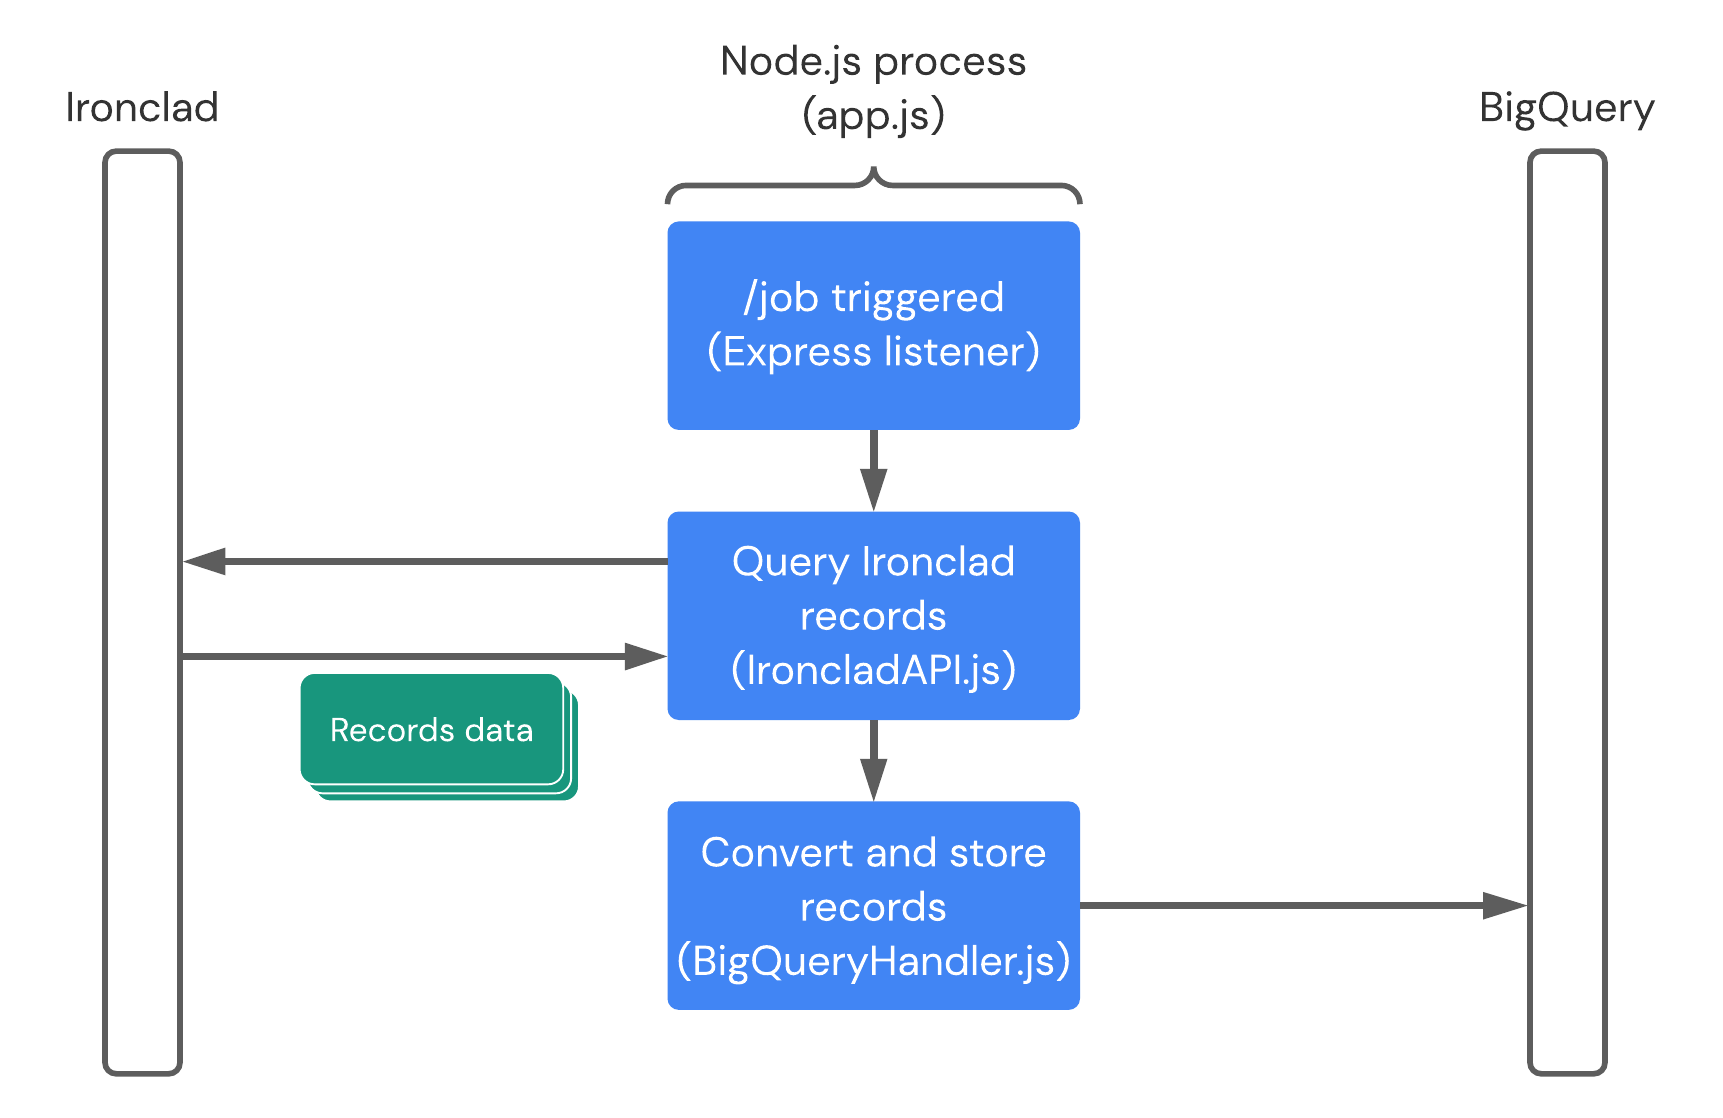
Node.js Process Overview Diagram
The figure below shows the overall runtime behavior of our Node.js process. Each run of the data load process is triggered by a request to a /job endpoint, which invokes a listener registered there in our app.js script. The process then calls the Ironclad API with an API key to load any new records to be loaded into BigQuery. The record data is then loaded into BigQuery using the BigQuery Node.js SDK.
Ironclad API
To retrieve records data, we use the /records route which offers a list of records that we can paginate through.
In order to minimize the need to paginate through all results every time we need to get data while also retrieving only recent data, we can filter the results based on the lastUpdated property of a record. This allows us to only retrieve records that have been updated since a set time, which reduces the number of overall API calls and the overall processing time of the service. This also ensures that we do not have duplicate records loaded in our BigQuery storage.
IroncladAPI.js
const axios = require('axios').default;
const apiKey = process.env.IRONCLAD_API_KEY;

class IroncladAPI {
  constructor(
    apiEnvironment = 'demo'
  ) {
    this.apiEnvironment = apiEnvironment;
    this.requestConfig = { headers: { 'Authorization': `Bearer ${apiKey}`}, };
  }

  validateApiResponse() {}

  get apiUrl() {
    switch (this.apiEnvironment) {
      case 'demo':
        return `https://demo.ironcladapp.com/public/api/v1`;
      case 'production':
        return `https://na1.ironcladapp.com/public/api/v1`;
      default:
        return `https://na1.ironcladapp.com/public/api/v1`;
    }
  }

  async retrieveRecordsData(lastUpdated) {
    let url = `${this.apiUrl}/records`;
    if (lastUpdated) url  = `${url}?lastUpdated=${lastUpdated}`;
    const response = await axios.get(
      url, this.requestConfig
    );
    return response.data;
  }
}

module.exports = {
  IroncladAPI
};
BigQuery
BigQuery offers multiple ways of ingesting data (please refer to their documentation). For this example, we will insert data into the table once we receive and parse it through a direct call to the BigQuery APIs (using their Node.js SDK). For higher-volume scenarios, you may want to consider alternative batch options of loading data.
BigQueryHandler.js
const { BigQuery } = require('@google-cloud/bigquery');

const BIGQUERY_PROJECT_ID = process.env.BIGQUERY_PROJECT_ID;

// Please consider alternate methods (e.g., Google Secret Manager)
const options = {
    keyFilename: `${__dirname}/service-account-file.json`,
    projectId: BIGQUERY_PROJECT_ID
};

class BigQueryHandler {
  constructor(
    datasetId = '',
    tableId = ''
  ) {
    this.datasetId = datasetId;
    this.tableId = tableId;
  }

  formatObjectToColumn(obj) {
    try {
      const jsonString = JSON.stringify(obj);
      return jsonString.replace(/\n/g, '');
    } catch (error) {
      console.error(error);
      return null;
    }
  }

  validateConfiguration() {
    if (this.datasetId == '' || this.tableId == '') {
      throw new Error('Dataset ID and Table ID are required.');
    }
  }

  validateSourceData(data) {
    if (!Array.isArray(data)) {
      throw new Error('Data must exist as an array.');
    }
  }

  async insertDataRows(data) {
    this.validateConfiguration();
    if (!data) throw new Error('Received no data!');
    this.validateSourceData(data);
    if (data.length === 0) return;
    const bigquery = new BigQuery(options);
    return await bigquery
      .dataset(this.datasetId)
      .table(this.tableId)
      .insert(data);
  }
}

module.exports = {
  BigQueryHandler,
};
Formatting & Parsing Record Data
Before sending data to BigQuery, we’ll want to do some minor formatting and structural changes that BigQuery requires for ingestion.
Key things to focus on:
- Ironclad date formats should be checked and tweaked for what BigQuery requires based on the date format you have selected in your schema
- In this example, we are formatting the date (if the date exists) to the ISO 8601 format as we are using the data type of “DATETIME”
- Attributes data is being stored as a JSON object in the “attributes” column. In order for this to work, we need to send it as Newline delimited JSON and have a function “formatObjectToColumn” to do this
- More information on Newline delimited JSON can be found here.
helpers.js
const formatDate = (dateString) => {
  const date = new Date(dateString);
  return date.toISOString().slice(0, -1);
};

const formatObjectToColumn = (obj) => {
  try {
    const jsonString = JSON.stringify(obj);
    return jsonString.replace(/\n/g, '');
  } catch (error) {
    console.error(error);
    return null;
  }
};

const checkAndFormatDateIfExists = (key, obj) => {
  try {
    if (key in obj) return formatDate(obj[key]);
    else return null;
  } catch(error) {
    console.error(error);
    return null;
  }
};

module.exports = {
  formatDate,
  formatObjectToColumn,
  checkAndFormatDateIfExists,
};
Record.js
const { formatObjectToColumn, checkAndFormatDateIfExists } = require('./helpers');

class Record {
  constructor(
    recordData
  ) {
    this.id = recordData.id;
    this.type = recordData.type;
    this.name = recordData.name;
    this.lastUpdated = checkAndFormatDateIfExists('lastUpdated', recordData);
    this.agreementDate = ('agreementDate' in recordData.properties) ?
      checkAndFormatDateIfExists('value', recordData.properties.agreementDate) :
      null;
    this.properties = formatObjectToColumn(recordData.properties);
  }
}

module.exports = {
  Record,
};
Initialization & Run
app.js
require('dotenv').config();
const express = require('express');
const {IroncladAPI, BigQueryHandler, Record} = require('./src');

const PORT = process.env.PORT || 3000;
const DATASET_ID = process.env.DATASET_ID;
const DATASET_TABLE = process.env.DATASET_TABLE;

const app = express();

// Insert data into BigQUery.
const insertBigQueryData = async (recordsData) => {
  const handler = new BigQueryHandler(DATASET_ID, DATASET_TABLE);
  return await handler.insertDataRows(recordsData);
};

// Retrieve records data from the Ironclad API.
// Note: You'll need to implement pagination to keep going,
// which is not shown in this example.
const retrieveRecords = async () => {
  const api = new IroncladAPI('demo');
  const date = new Date(Date.now() - 1 * 6 * 60 * 60 * 1000);
  const records = await api.retrieveRecordsData(date.toISOString());
  return records.list;
};

// Run!
const runJob = async () => {
  const records = await retrieveRecords();
  const processedRecords = records.map(record => new Record(record));
  return await insertBigQueryData(processedRecords);
};

app.get('/job', async (req, res) => {
  try {
    await runJob();
    res.sendStatus(200);
  } catch (err) {
    console.log(err);
    res.sendStatus(500);
  }
});

app.listen(PORT, () => console.log(`Listening on port ${PORT}.`));

module.exports = app;
Visualization
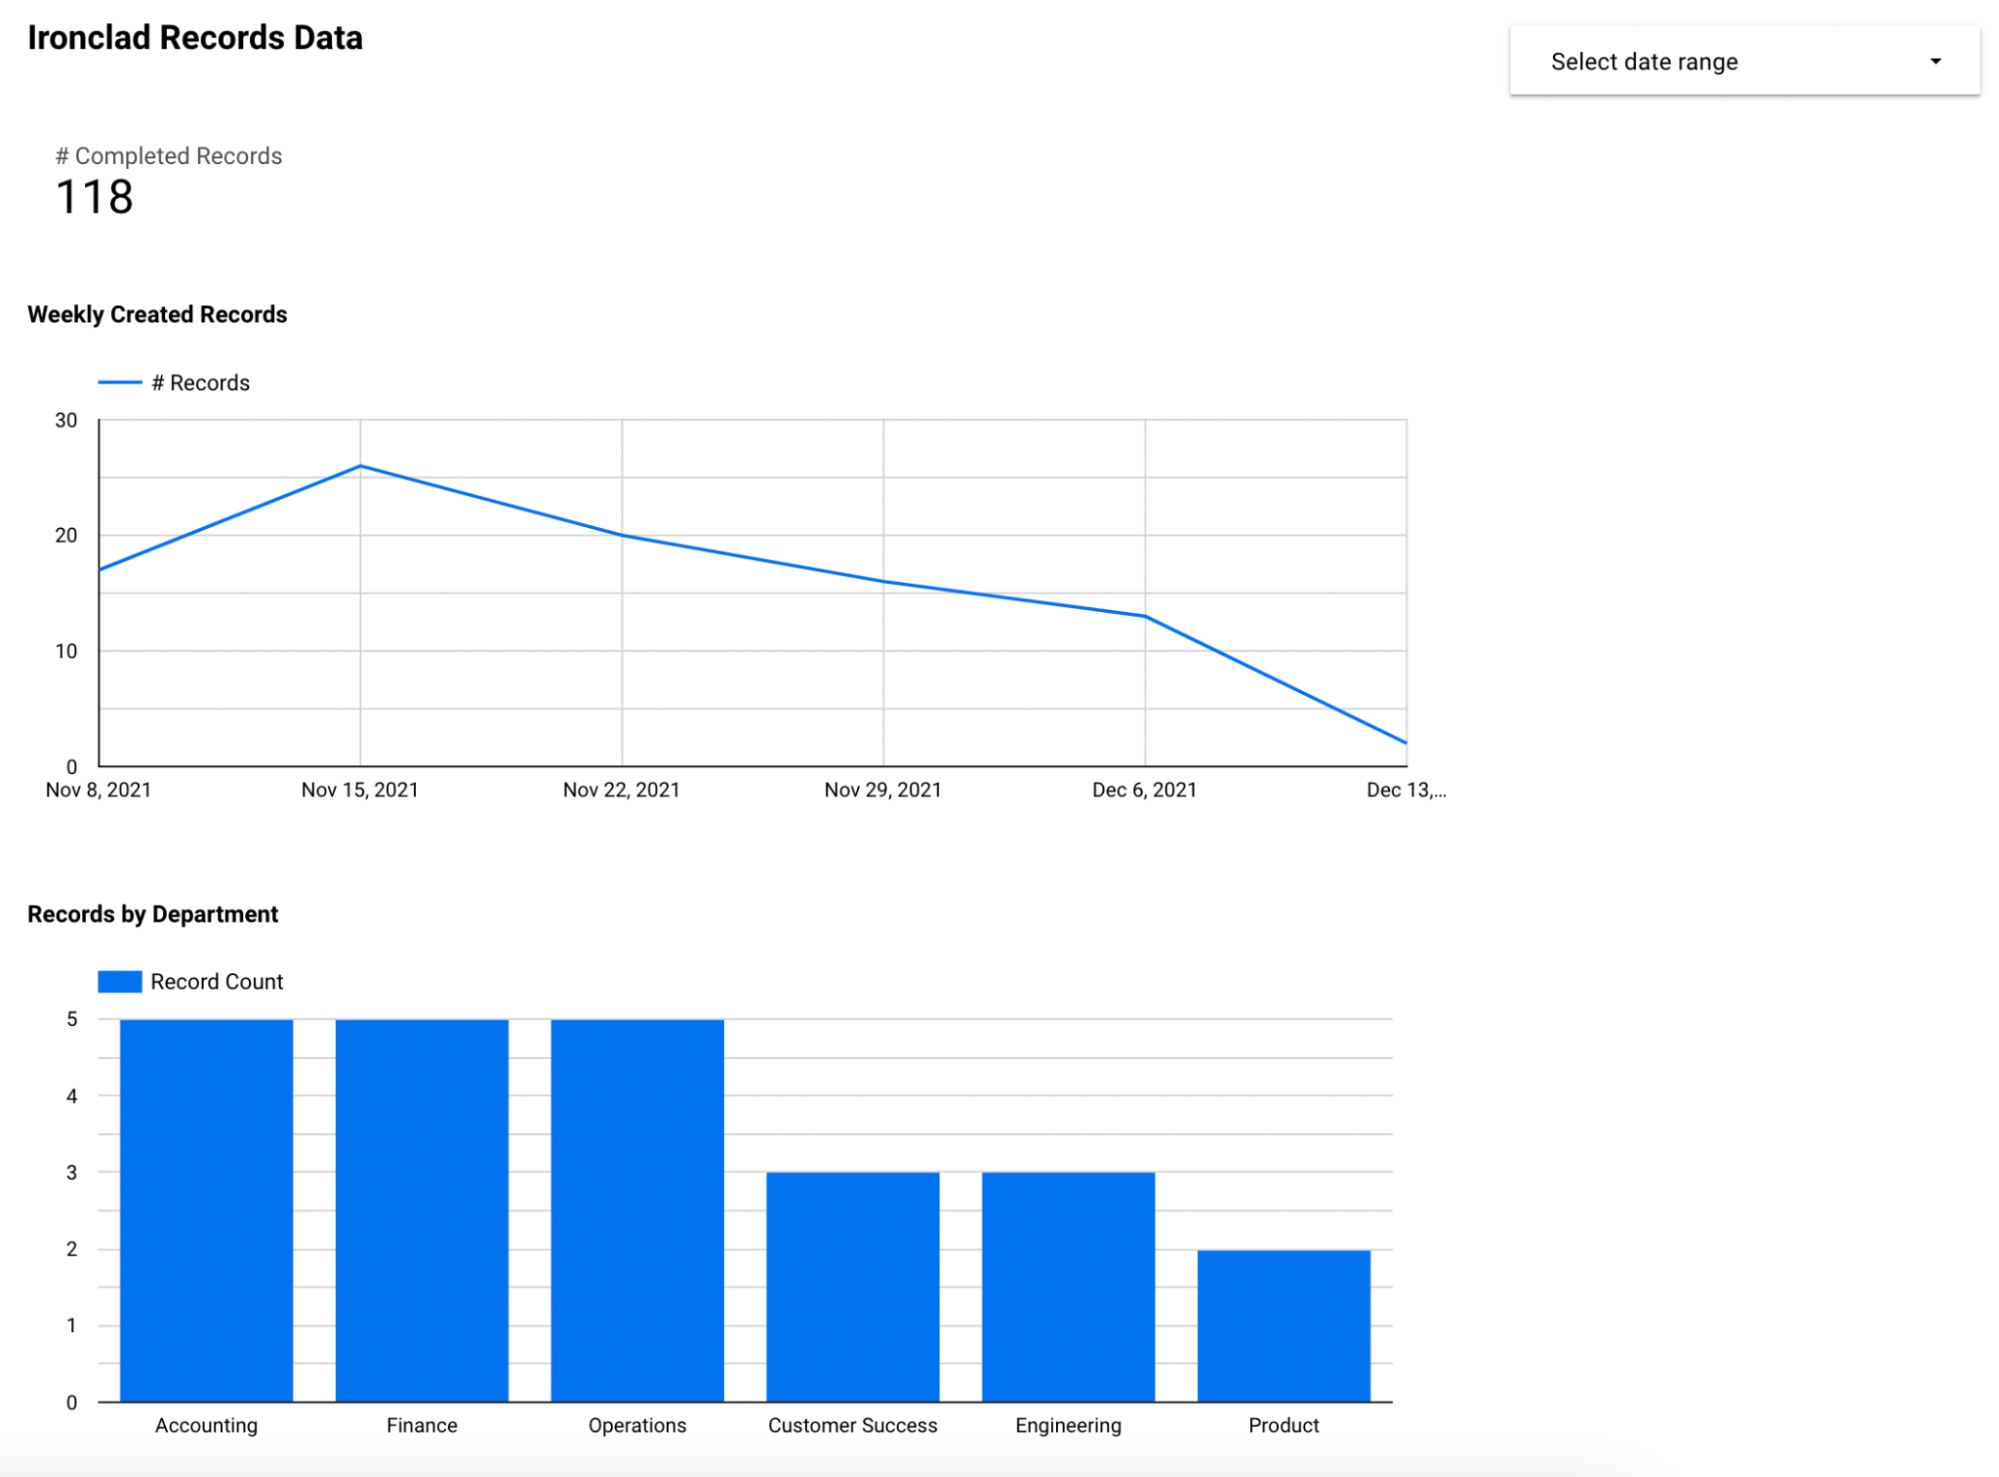
In this example, we use Google Data Studio, with the native Google Data Studio & BigQuery integration, to visualize the records data that we’ve stored. In this example report, we're using the BigQuery view we defined earlier to show some basic metrics on contracts, including the department details that we included in that view. These include:
- Total number of records completed
- Number of records created on a weekly basis
- Records by department (value of a specific field on a workflow)
This view would help a legal team to understand basic productivity metrics of their team. We could further break down the data to show contract records by type of contract, or by any other properties that are defined on the Ironclad workflow.
Example Chart
Example Chart Configuration
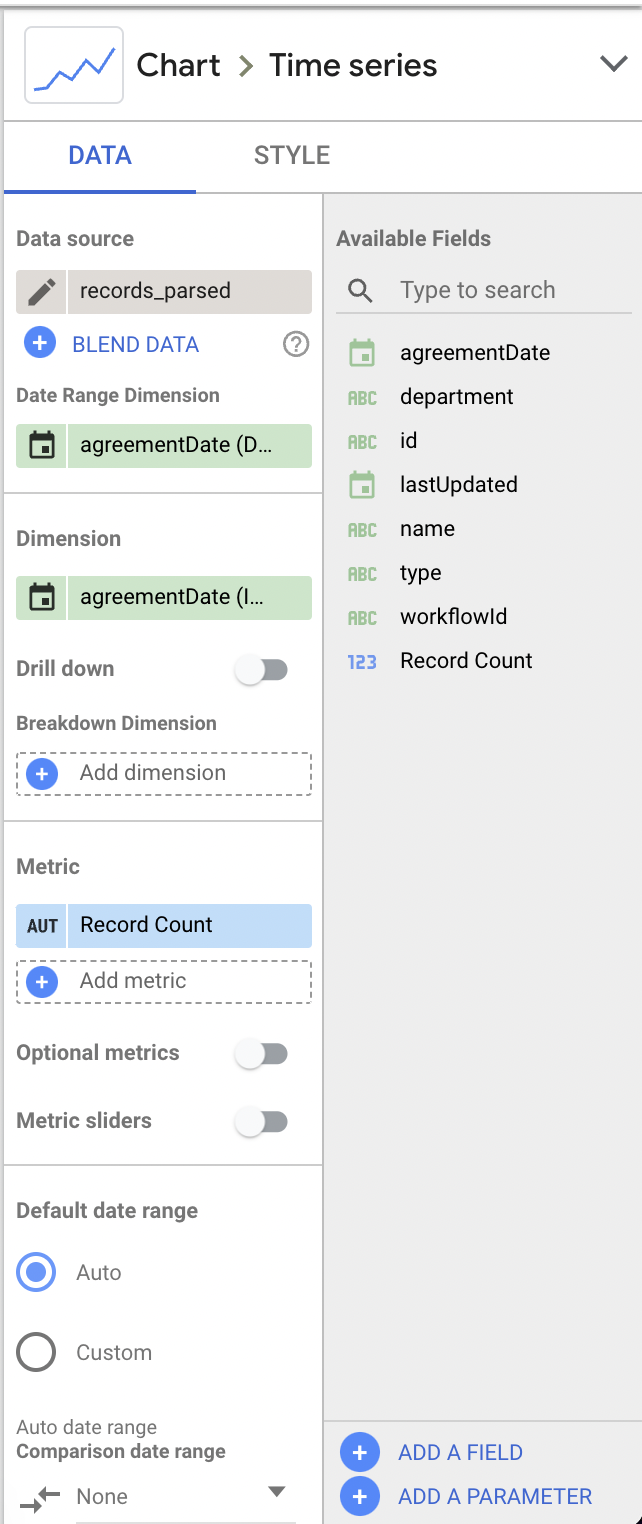
The figure below shows how to configure the first time-series chart in our report.
Since we're inserting every Ironclad record as a row into BigQuery, we can use the default aggregate "Record Count" metric provided by Google Data Studio to get a count of records. With the provided "Record Count" metric and using the agreementDate field value as the "Date Range Dimension", we can create a chart showing the # of agreed records over time.
The second chart in our report is equally simple to configure using the same BigQuery view and the source. We would instead choose Bar Chart as the chart type, defining a metric based on record count by department, and choosing the department field as the dimension.
Updated 10 months ago